Around 120km North of Nairobi, nestled on the floor of Kenya’s Great Rift Valley lies Lake Elmenteita. Named from the Maasai word ‘ol muteita’ meaning place of dust, the alkaline lake is a lifeline for thriving populations of birds and wildlife, including Rothschilds giraffes, pelicans, colobus monkeys and flamingos.
Over 450 species of bird call the lake home, and the ecological significance of the area was recognised in 2005, when Elmenteita was recognised as a Wetland of International Importance.
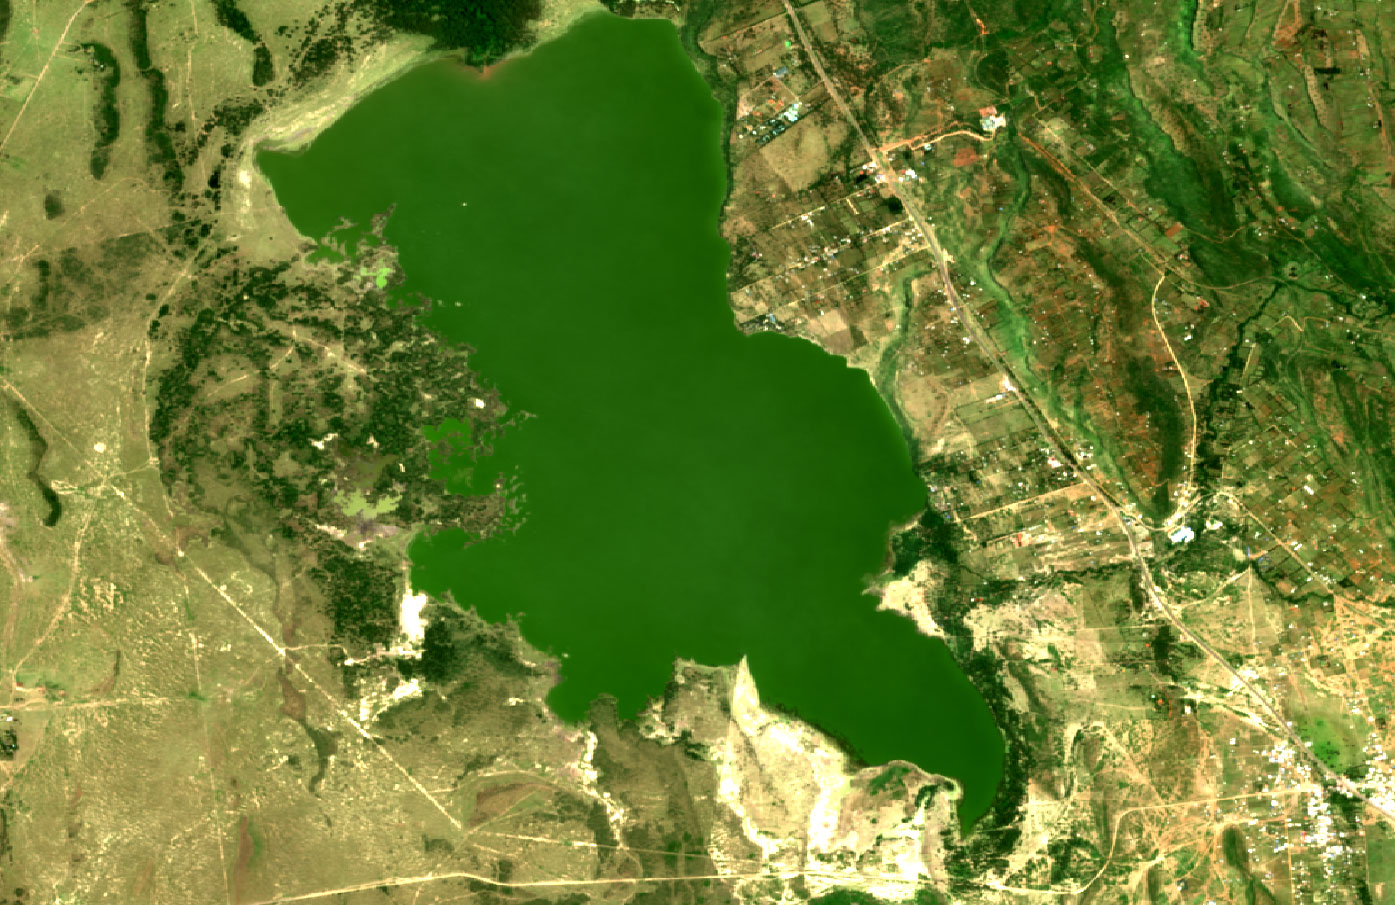
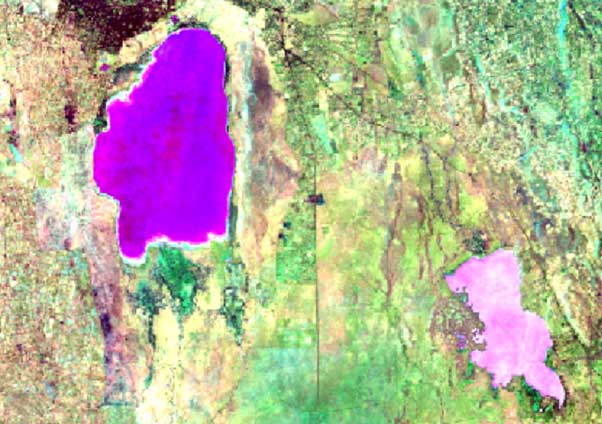
Lake Elmenteita: 2020 Geomedian (Sentinel-2 data processed by Digital Earth Africa)
The problem
As home to such a delicate ecosystem, seasonal changes in the lake’s water levels, water quality and salinity can have huge impacts upon the wildlife populations that live there.
Eric Lawrence Nganga, a Data Analyst at one of Digital Earth Africa’s Partners - the Regional Centre for Mapping of Resources for Development (RCMRD) noticed that increased rain during the wet season was causing a number of problems for the flamingo population around the lake, including:
- The destruction of potential breeding grounds by rising waters, reducing the number of flamingos.
- Reduced salinity of the lake water which hinders the growth of blue-green algae – a key food source for these flamingos and, incidentally, the reason that the birds are pink.
A rise in human activity around Lake Elmenteita was also contributing to changes in habitat.
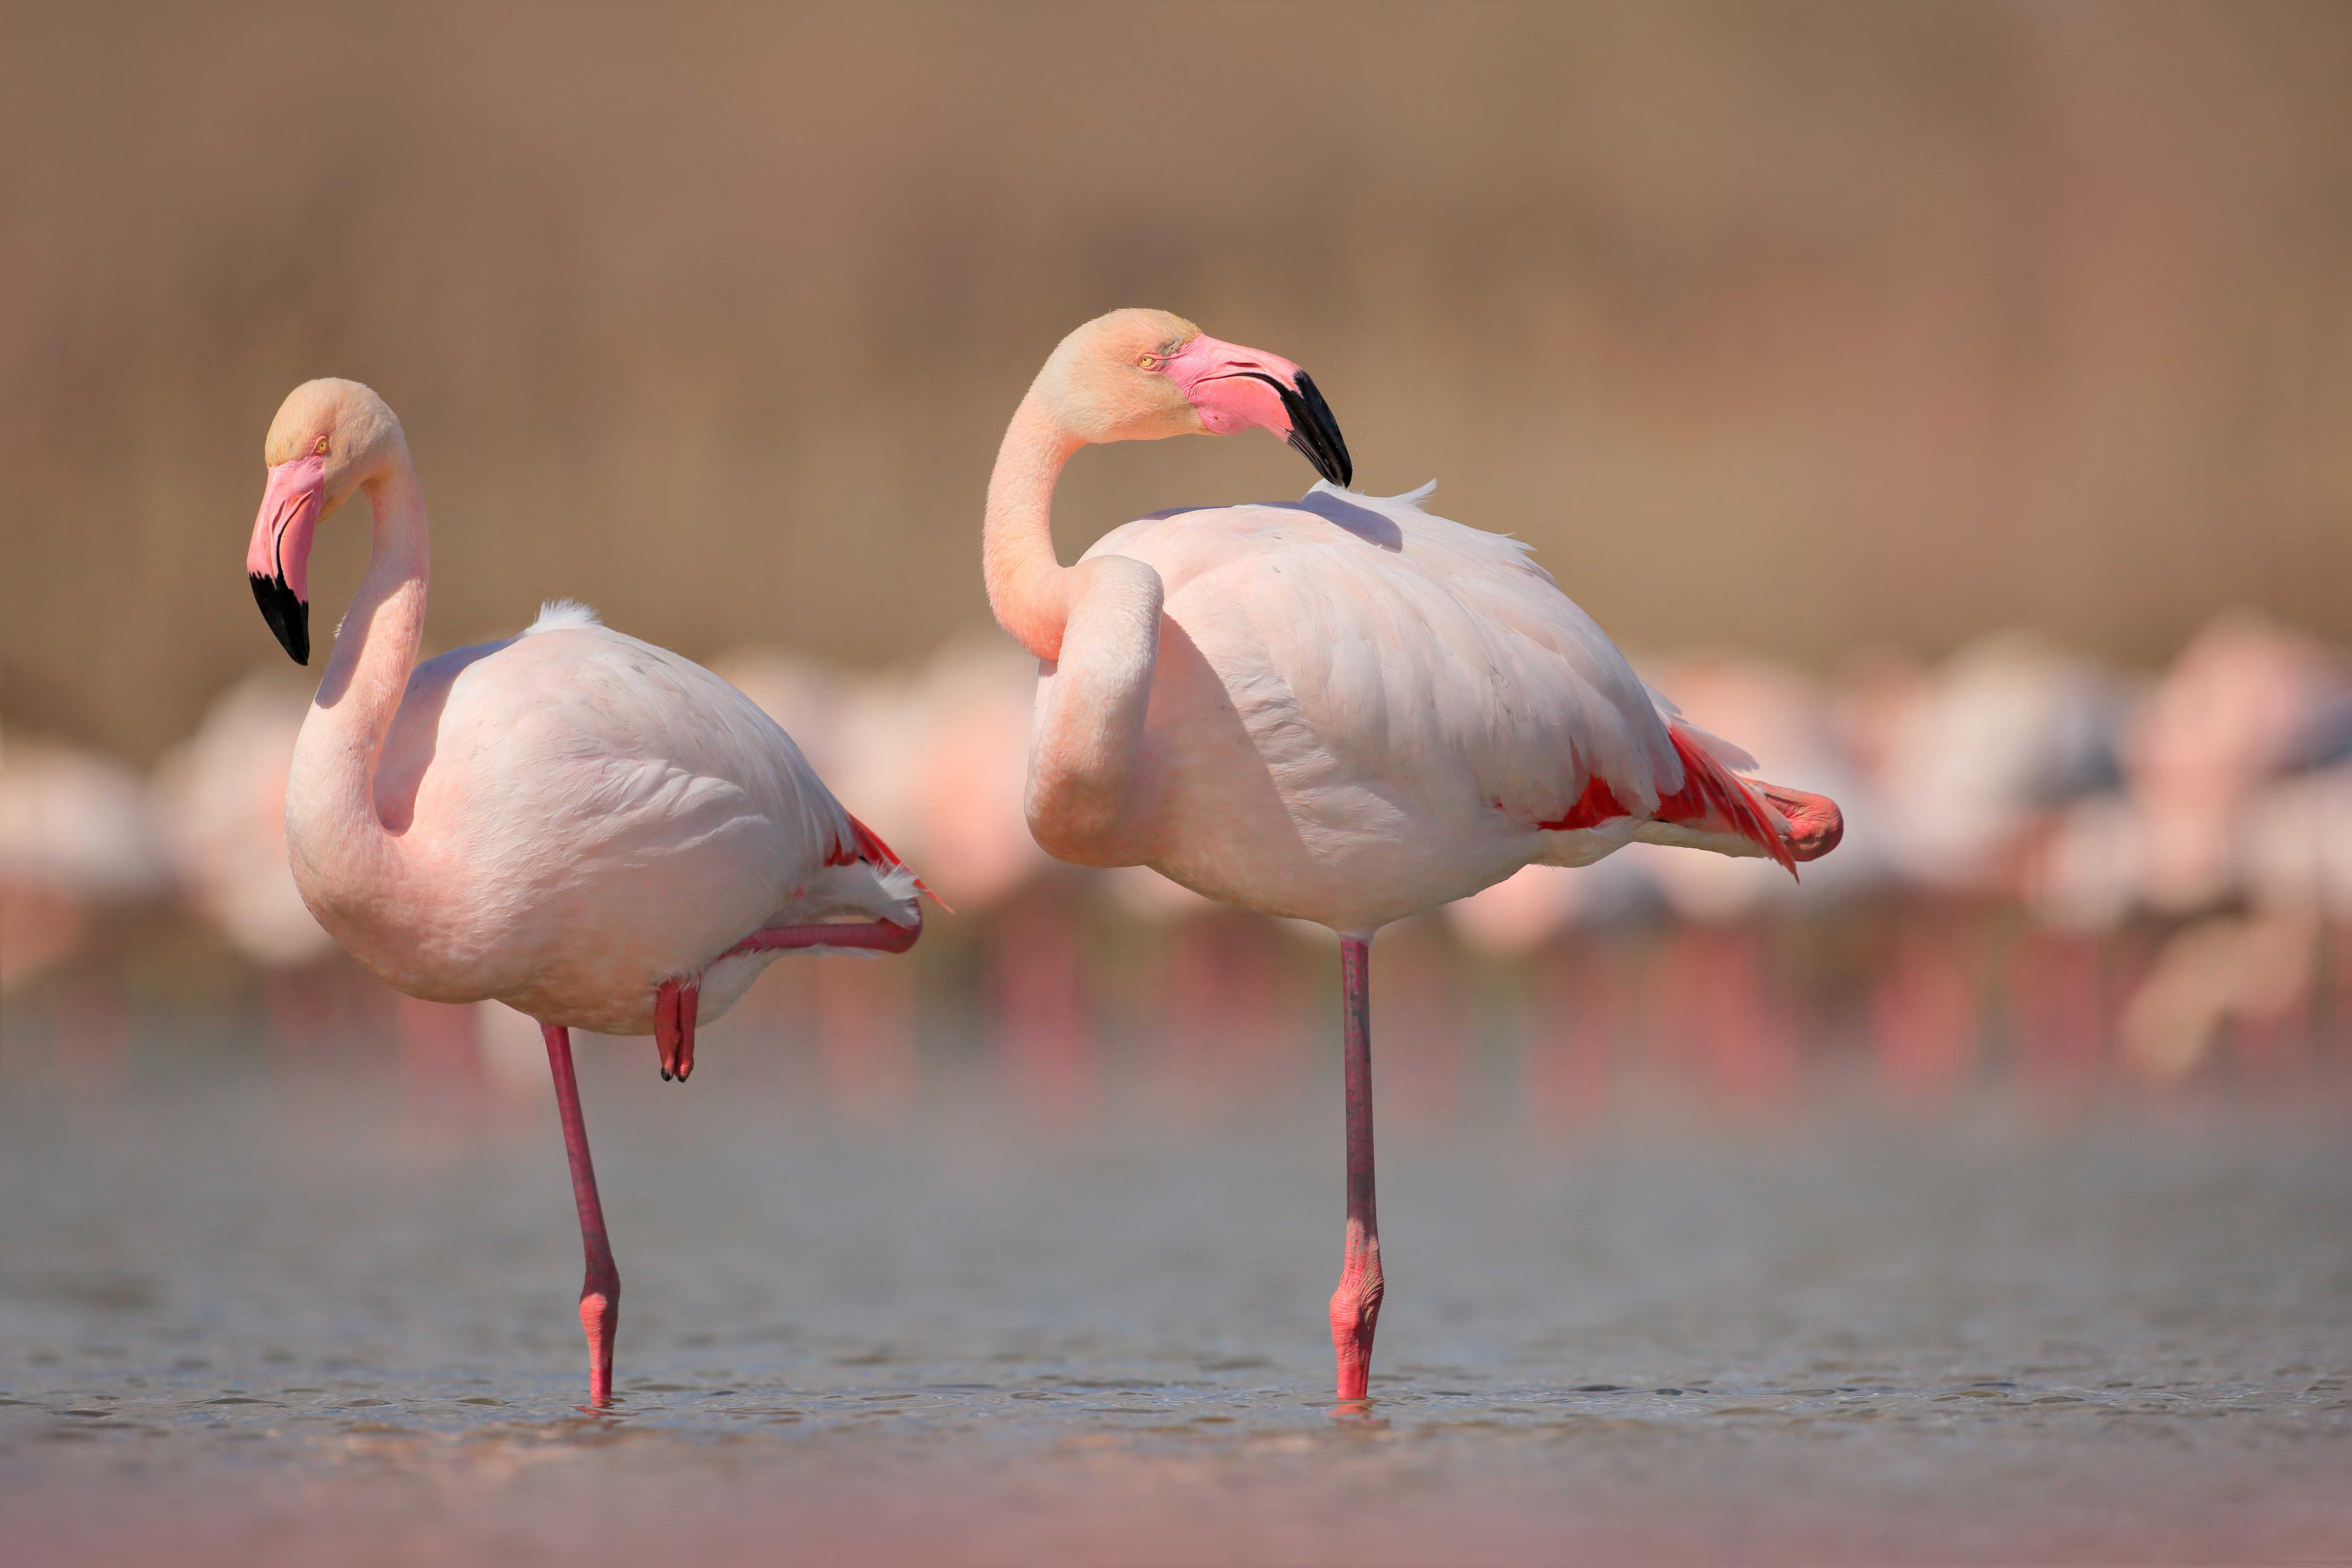
Image credit: Shutterstock
From data to insights
Measuring the extent of water in Lake Elmenteita
Eric wanted to look deeper into these issues. First, he wanted to establish the extent of the water in the lake. To achieve this, he used Digital Earth Africa’s Modified Normalised Difference Water Index (MNDWI).
MNDWI is a fantastic way of viewing water in detail, and is much more effective than relying on the traditional ‘bird’s eye view’ provided by true colour Earth Observation imagery. It is calculated by looking at the green and shortwave infrared data bands (SWIR) from satellite imagery. Filters are then added to the data to remove any pixels from the image that don’t represent water, allowing analysts to calculate the size of the water body – in this case Lake Elmenteita – in square kilometres.
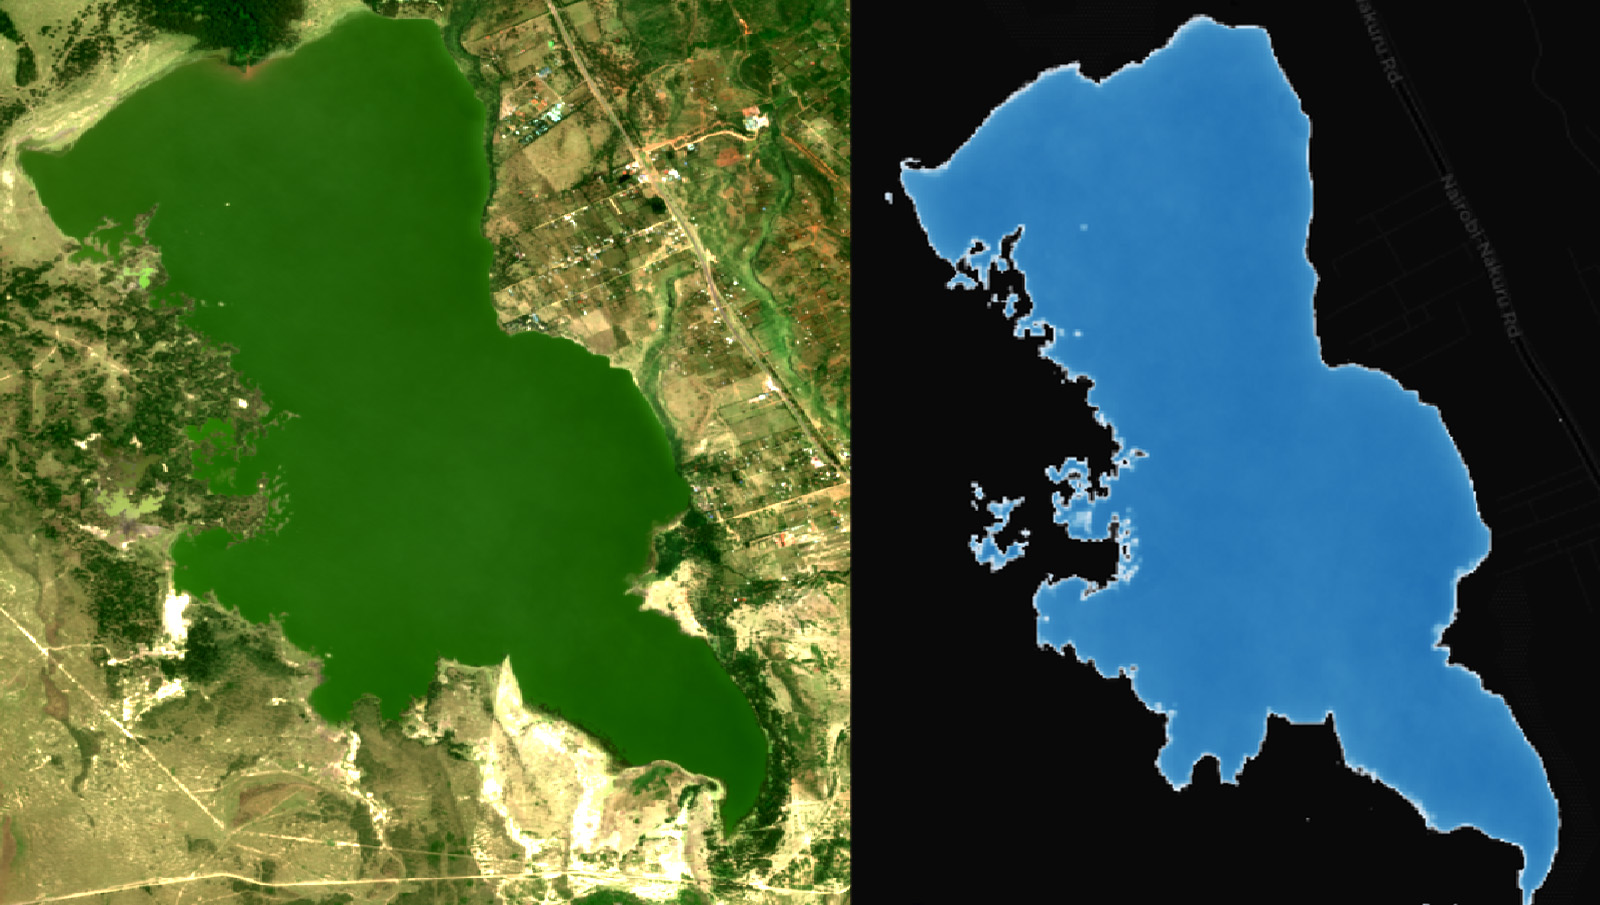
(L) - Lake Elmenteita: 2020 Geomedian in RGB (R) - Lake Elmenteita: 2020 Geomedian in MNDWI (Sentinel-2 data processed by Digital Earth Africa)
Eric’s findings are below in the form of a graph, which demonstrate how the lake grew and shrunk in its extent from January 2018 to January 2020. The long-rains wet season of March-May 2018 was one of the wettest on record. This extreme event is reflected by the major increase in lake levels visible from the graph below and satellite imagery taken during this period. In the below graph, you might also note a significant dip around June 2019, when Kenya was experiencing severe drought - likely to be caused by El Nino.
Variations in Lake levels can be problematic for the flamingos that call it home. It takes around 30 days to incubate a flamingo egg, so rapidly rising water can threaten the safety of nesting grounds, putting both eggs and fledglings at risk of being submerged.
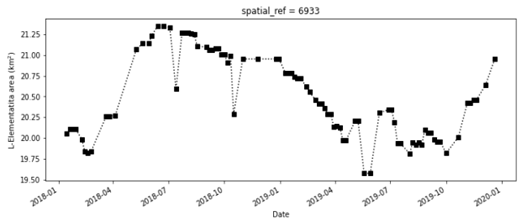
Lake Elmenteita extent in km2
Water quality of Lake Elementaita
After measuring the water extent, Eric wanted to map the water quality of the lake. While the health of water bodies is often monitored via on-the-ground sampling, these methods can be complemented by satellite data – in this case Digital Earth Africa’s operational archive of Earth observation imagery, dating back to the 1980s.
Eric wanted to check for the presence of algal blooms - otherwise known as flamingo food. Algae thrives even in some of the world’s most inhospitable alkaline lakes. As a primary food source for many flamingo populations, the daring birds are adapted to spend time wading and feeding in significantly alkaline environments that the human body couldn’t withstand.
One way of assessing algae levels is looking for the presence of chlorophyll-a, using the Normalised Difference Chlorophyll Index (NDCI) developed by Mishra and Mishra in 2012. The NDCI serves as a qualitative indicator for the concentration of chlorophyll-a on the surface of a waterbody. To put it simply, the more chlorophyll-a, the more algae, the more food for flamingos.
DE Africa has implemented this index, using Copernicus Sentinel 2's 13 spectral bands, so that the NDCI can be calculated from satellite imagery. High values of NDCI indicate the presence of chlorophyll-a.
By performing the relevant calculations across two years’ of data, Eric found variations in chlorophyll level as recorded in the below graph.
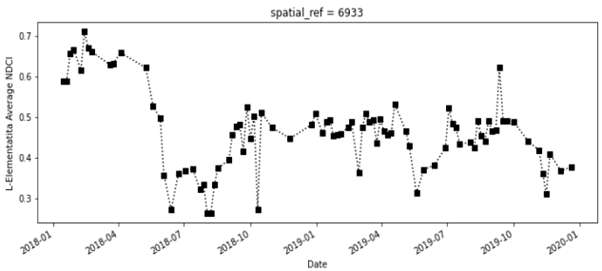
Figure 2: Average NDCI in Lake Elmenteita
Producing a combined analysis
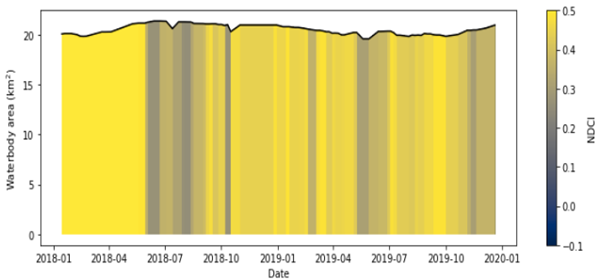
After calculating the total water extent and average NDCI, Eric combined the two data sets to produce a single summary plot as shown below. An NDCI value of 0.5 and above, corresponds to a high concentration of chlorophyll-a, while NDCI value of -0.1 corresponds to low concentrations of chlorophyll-a.
The drop off in chlorophyll towards mid-2018 could be associated with the increase in the extent of the Lake. Extra water can dilute the salinity and alkaline levels of lakes, creating a less hospitable environment for algae - and therefore a reduced food source for flamingos. Where water extent and chlorophyll concentration have both increased it is likely that the rainwater washed additional nutrients into the Lake, strengthening algae populations.
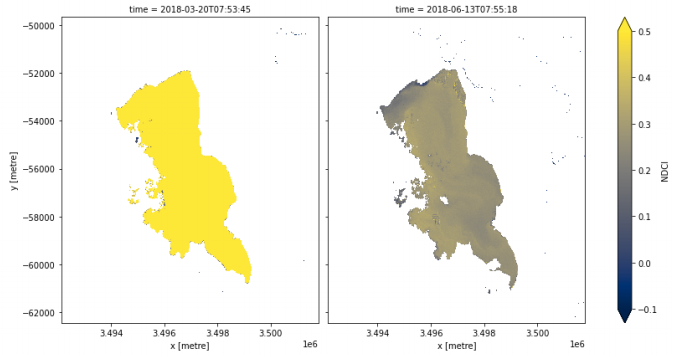
DE Africa also provides a spatial comparison at different NDCI levels and dates. In the below, the left image shows when NDCI values were very high while the right image shows when NDCI values were very low.
What this means for the future
The results of Eric’s work will be crucial inputs for government agencies such as the Kenya Wildlife Service (KWS), who are managing the Lake Elmenteita site and monitoring this vital nesting and breeding ground for great white pelicans and flamingos in the Great Rift Valley. By mapping correlations between Eric’s findings and bird counts, efforts can be made to protect this important habitat into the future as Kenya continues to battle with the effects of variable rainfall on its delicate ecosystems.
Diving into the data
If you would like to view the notebook used by Eric to perform his analysis, it is freely available in the DE Africa sandbox.
The variation of the extent of water bodies can be analysed using the water extent monitoring notebook available freely in the Digital Earth Africa Sandbox.
Another example of how this notebook has been applied - to combat drought - can be found here.
Another powerful way to analyse the movement and location of surface water is DE Africa Water Observations from Space product or WOfS that can be also accessed through our interactive Map.
If you would like to study annual MNDWI and NDCI at 10m resolution for all of Africa, use our GeoMAD data service.
Using GeoMAD to study Lake Elmenteita
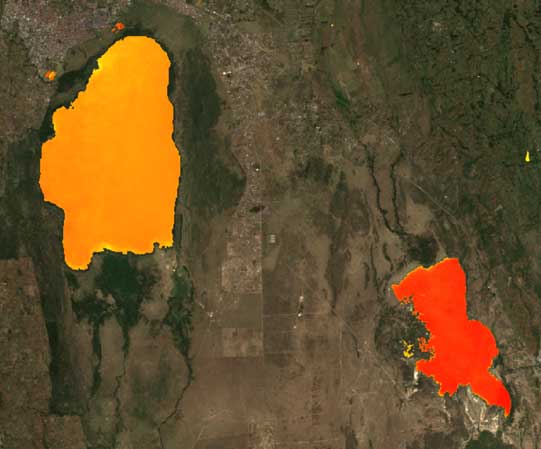
NDCI derived from 2018 geomedian overlayed on the geomedian for Lake Elmenteita (right) and Lake Nakuru (left).
Triple MADs showing different variability patterns of reflectance during year 2018 for Lake Elmenteita (right) and lake Nakuru (left).
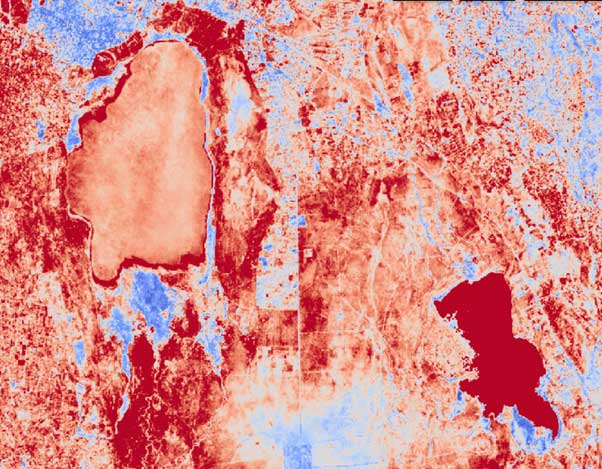
High spectral MAD (indicated by deep red color) over Lake Elmenteita on the right suggests high color variability in 2018.
About Eric Lawrence Nganga

Eric has worked in geo-information, data management, land management, spatial science, remote sensing, and climate change. He holds a Master’s degree in Geographic Information Systems from Nairobi University and a Bachelor’s degree in Environmental Planning and Management from Kenyatta University.
With years of hands-on experience in GIS, Eric currently works at the Regional Center for Mapping of Resources for Development (RCMRD) as a Data Technician. He has implemented various geospatial analysis tasks while participating in a range of projects such as: forest landscape restoration opportunities mapping in Makueni County Kenya, Rwanda Natural Capital Accounting Program, the System for Land-based Emission Estimation in Kenya (SLEEK) program and land cover mapping for greenhouse gases.
His areas of expertise are in Geospatial big data analysis and value addition, data management archiving and dissemination, marketing high resolution and commercial data. Eric has travelled widely and been involved in capacity building of government staff from several countries in East and Southern Africa.