The highest mountain in Kenya - and the second highest on the African continent - Mount Kenya is enclosed within the Mount Kenya National Park which covers an area of 715 km2 in the central highlands of the country. The National Park and Forest Reserve were designated as a UNESCO World Heritage Site in 1997 and are a key driver of both local and international tourism to Kenya.
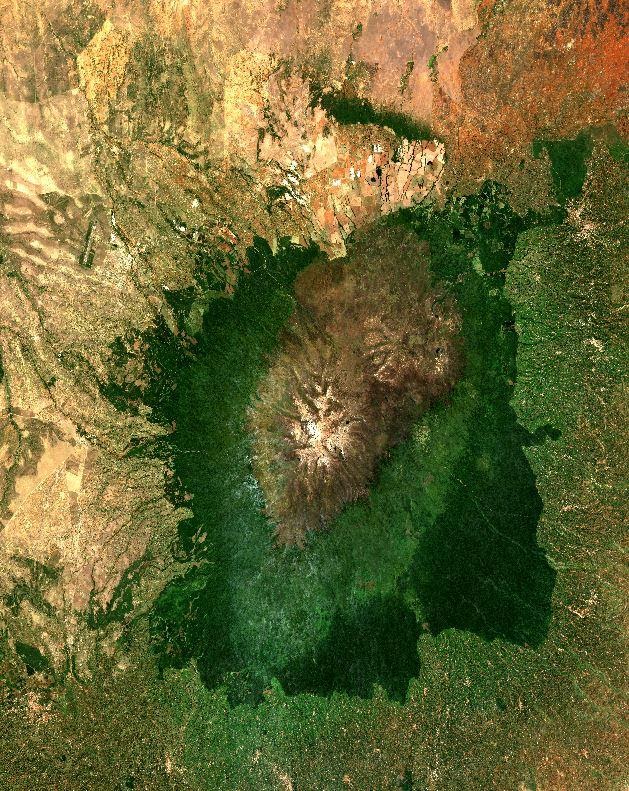
Figure 1: Sentinel-2 RGB image view of Mount Kenya in 2019
Despite its protected status, there are occasional fires in the National Park, most notably in March 2019. Remote sensing can be a useful technology to identify fire-affected areas and monitor post-fire regrowth within the National Park. Digital Earth Africa (DEA) is helping Eric Nganga from the Regional Centre for Mapping of Resources for Development (RCMRD) to provide a rapid assessment of the impact of fires in Mount Kenya.
DE Africa is providing access to free and open Analysis Ready Data from Sentinel-2 (available at 10 metre resolution) along with technology and a range of algorithms and to provide insights into fire-affected regions.
Normalized Burn Ratio (NBR) calculations
The Normalized Burn Ratio (NBR) is an index designed to highlight burnt areas in large fire zones, by measuring how healthy, green vegetation and burnt vegetation reflect light differently. DEA calculates burnt area extent by measuring the change in NBR before the fire (using a baseline composite image) and after. NBR uses Near Infrared/Band 8 (NIR) and Shortwave Infrared/Band 12 (SWIR) Sentinel-2 bands, as shown in the equation below:
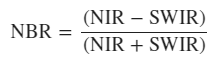
NBR values range between -1 and 1. Healthy green vegetation will have a high NBR value while burnt vegetation will have a low value. Areas of dry, brown vegetation or bare soil will also return lower NBR values than green vegetation.
NBR in practice
To map the fire extent on Mount Kenya National Park, Eric focused on an area with extent of 30 km by 50 km centred on latitude -0.18 South, longitude 37.3 East. The date of the fire in question was noted as 10th March 2019 and a baseline of 3 months was considered for this analysis. So the relevant dates were noted as follows:
- Start date, pre: 9th December 2018
- End date, pre: 9th March 2019
- Fire date: 10th March 2019
- Start date post fire: 11th March 2019
- End date post fire: 9th April 2019
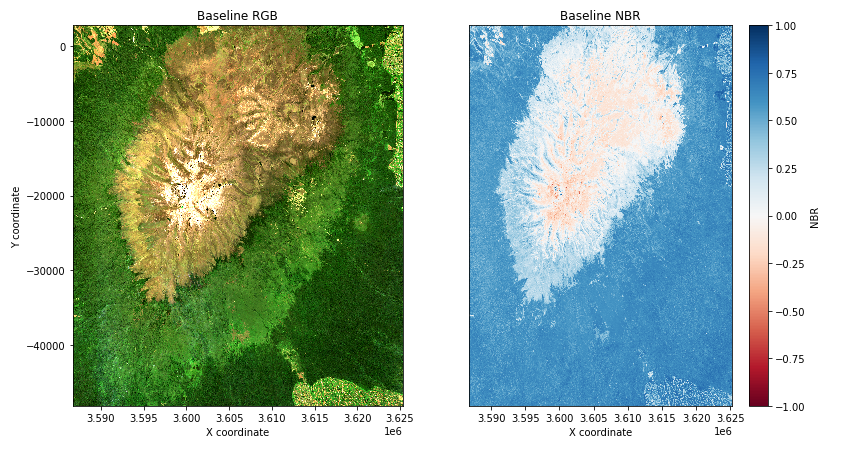
Figure 2: Red-green-blue (RGB) and Normalised Burn Ratio (NBR) maps of the study area for the baseline period December 2018 to March 2019
DE Africa made it possible to compare forest hotspots from the Fire Information for Resource Management System (FIRMS), which plots hotspots observed from satellites for Near Real-Time (NRT) active fires and historical fires. The hotspot information is generated from both the Moderate Resolution Imaging Spectroradiometer (MODIS) and the Visible Infrared Imaging Radiometer Suite (VIIRS). DE Africa uses the hotspot data from FIRMS to analyse the changes in NBR at the locations identified as active (or historical) fire as shown in Figure 3 below.
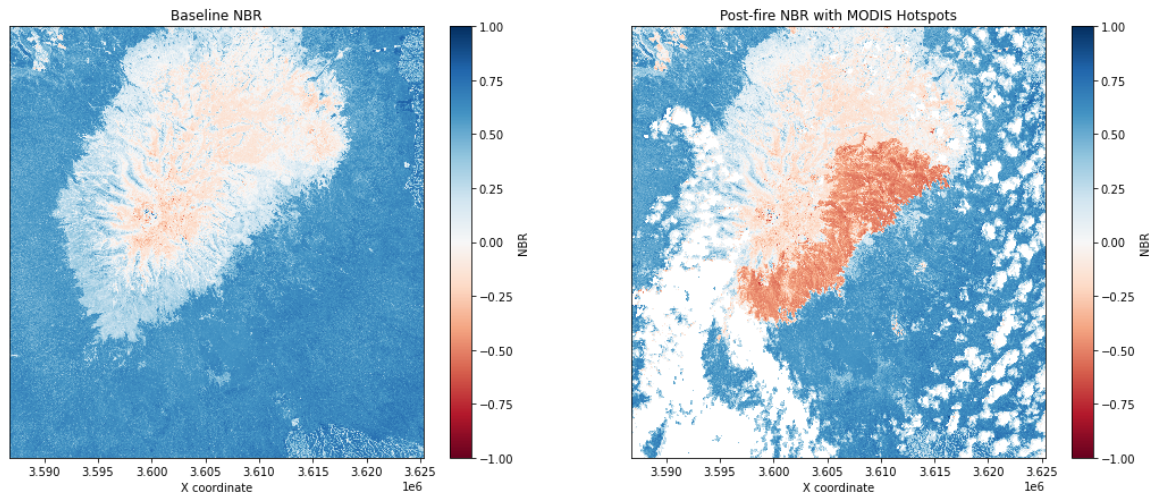
Figure 3: Plot of post-fire NBR with MODIS hotspots
DE Africa can extract NBR values at the hotspot locations for both the baseline and post-fire NBR images, allowing for assessment into how the fire has influenced the NBR values as shown in Figure 4 below.
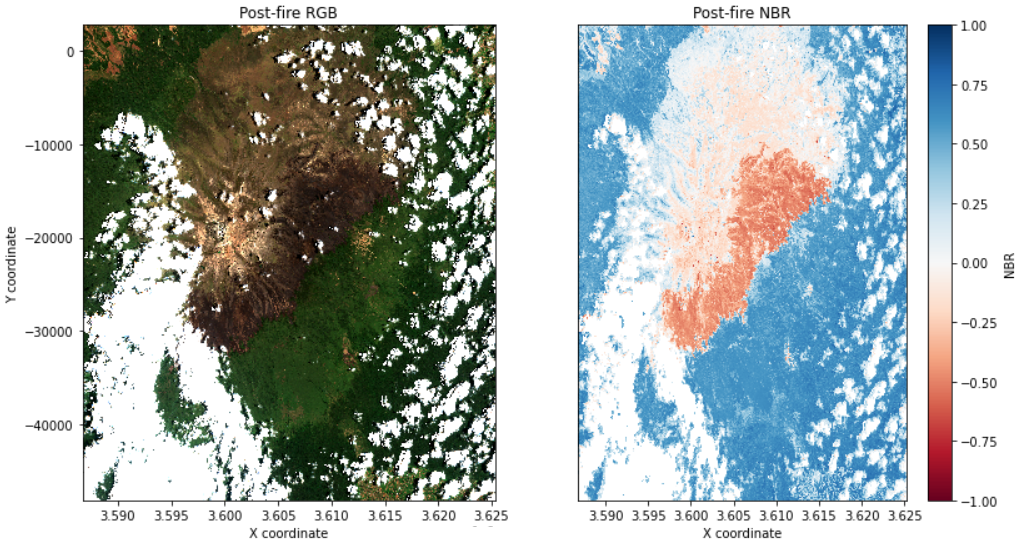
Figure 4: Plot of post-fire Sentinel 2 RGB and Post-fire NBR
DE Africa also computes the Delta Normalized Burn Ratio (dNBR), i.e. the change in Normalized Burn Ratio (NBR) by subtracting the post-fire NBR values from the baseline NBR value as defined in the below equation and in Figure 5. The dNBR value can be more useful than the NBR alone to determine what is burnt as it shows change from the baseline state. A burnt area will have a positive dNBR value while an unburnt area will have a negative dNBR value or a value close to zero.
![]()
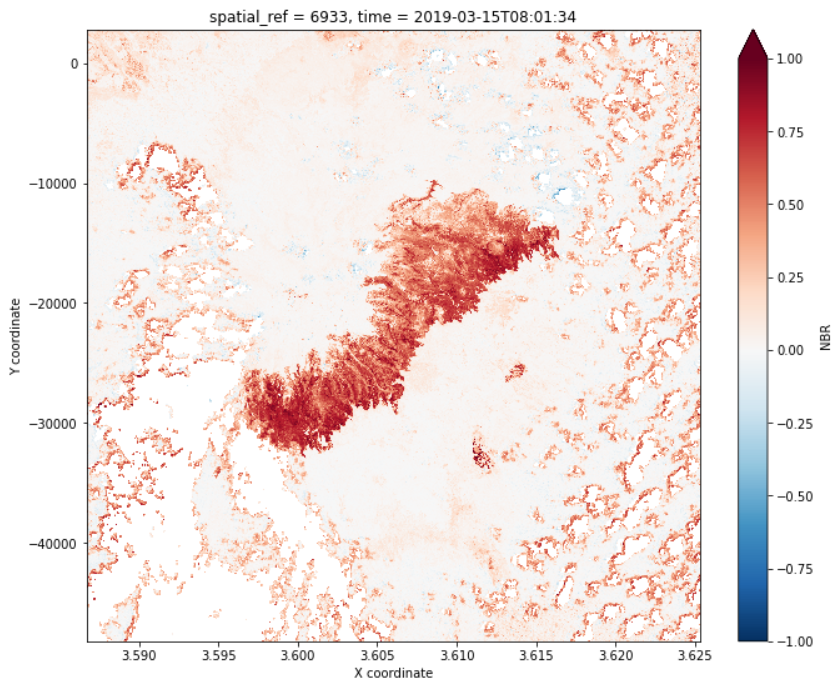
Figure 5: Delta Normalized Burn Ratio (dNBR) showing the burnt area as well as fire severity within the park
Eric also applied a dNBR threshold value to try to reduce false positives, only keeping areas with dNBR values greater than the chosen threshold value (e.g. 0.3) as shown in Figure 5. The chosen threshold value may need to be adjusted depending on the use case.
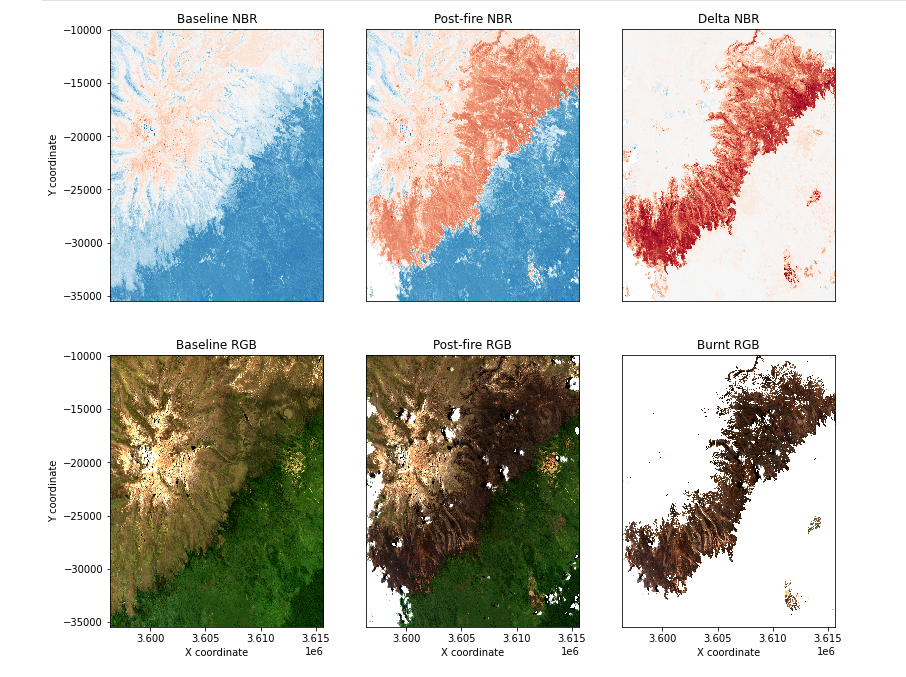
Figure 6: Apply threshold to Delta Normalized Burn Ratio
DE Africa was able to provide an assessment of the burnt area based on Sentinel-2 pixels, which displayed those areas with dNBR values greater than the set threshold. A number of other statistics were generated, accounting for areas that have no data as shown below.
Supporting decision making
DE Africa helped Eric to generate a quick assessment of the burnt area with the forest at around 90 km2 (about 10% of the area). This will be useful in engagement with the Kenya Forest Service (KFS), which has been mandated with the task of monitoring forest cover. His work will also help to inform policy makers in their efforts to conserve the forest and will help Kenya to report on the UN’s Sustainable Development Goals (SDGs).
About Eric Lawrence Nganga

Eric has worked in geo-information, data management, land management, spatial science, remote sensing, and climate change. He holds a Master’s degree in Geographic Information Systems from Nairobi University and a Bachelor’s degree in Environmental Planning and Management from Kenyatta University.
With years of hands-on experience in GIS, Eric currently works at the Regional Center for Mapping of Resources for Development (RCMRD) as a Data Technician. He has implemented various geospatial analysis tasks while participating in a range of projects such as: forest landscape restoration opportunities mapping in Makueni County Kenya, Rwanda Natural Capital Accounting Program, the System for Land-based Emission Estimation in Kenya (SLEEK) program and land cover mapping for greenhouse gases.
His areas of expertise are in Geospatial big data analysis and value addition, data management archiving and dissemination, marketing high resolution and commercial data. Eric has travelled widely and been involved in capacity building of government staff from several countries in East and Southern Africa.