Digital Earth Africa is proud to launch a new, operational continental service, providing monthly high-resolution cloud-free composites for the entire African continent. This service is the latest in a series of Digital Earth Africa Earth observation products designed to support informed decision making for sustainable development and climate action. The Rolling Monthly GeoMAD plays a crucial role in measuring and monitoring changes in the Earth’s surface, which are critical steps in addressing country-specific climate related challenges and in identifying priorities for action.
By combining multiple images, the approach effectively creates a single high-quality pixel composite with reduced spatial noise from a temporal stack of observations. Through the provision of seamless, cloud-free coverage and derived statistical information over the whole continent, the Rolling Monthly GeoMAD provides new opportunities to monitor the evolution of landscape changes including crop growth and health and forms an important input to machine learning approaches for change detection, land cover mapping, and environmental monitoring.
Available monthly from January 2019, the service provides a further routine, reliable, and free source of analysis ready Earth observation data from Digital Earth Africa. Expanding the current DE Africa Sentinel-2 GeoMAD services (which are produced on an annual and semi-annual basis), the Rolling Monthly GeoMAD is produced for the whole continent but on a monthly basis. Using a three-month moving window, this new GeoMAD condenses three calendar months’ worth of satellite images to create two output components; the geomedians which are cloud-free composites for each spectral band, and three Median Absolute Deviation (MAD) layers which are higher-order statistical measurements calculating variation relative to the geomedian.
Supporting agricultural monitoring and food security
The Rolling Monthly GeoMAD is a key component of a DE Africa end-to-end framework for crop type mapping, which takes users through the steps of field data collection, model development, and map production. Operational information on crop growth and agricultural production is an essential step in addressing national food security and identifying potential risks.
Through a partnership between DE Africa, the International Monetary Fund, and The World Food Program, Kelsee Bratley, a PhD candidate at Boston University has been using the Monthly Rolling GeoMAD to map cropland in Mozambique, to understand the impacts of extreme climatic events on national agricultural production.
Kelsee found that “the Rolling Monthly GeoMAD product significantly improved the identification of agricultural areas and resulted in higher class accuracies, which provided more accurate insights into Mozambique's agricultural landscape”
Variations between the geomedian and the individual measurements are captured by the three Median Absolute Deviation (MAD) layers. The MAD layers can be used on their own or together with the geomedian to gain insights about the land surface, and understand changes over time, such as developments within irrigated agriculture during the dry season.
Addressing data gaps due to frequent cloud cover
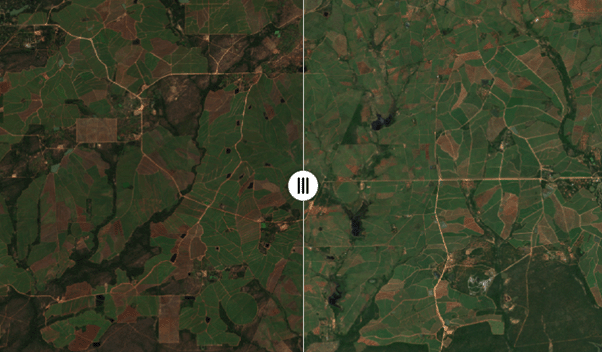
The Rolling Monthly GeoMAD can be particularly helpful when analysing areas with heavy cloud cover, such as tropical or coastal areas of Africa. The composite nature of the service also provides improved summaries for areas of high rainfall, which can be cloudy in individual daily image captures. The service combines the cloud-free surface reflectance values over the specified time period to create a representative value (the geomedian) for each pixel. This can be used to generate true-colour images that represent what is on the ground.
You can explore the versatility of Rolling Monthly GeoMAD data from the Digital Earth Africa Map by navigating to Surface Reflectance, Rolling Monthly GeoMAD (Sentinel-2), in the catalogue and selecting options from the “Style” dropdown menu.
For more information about GeoMAD, view the product details on Digital Earth Africa Docs. Sandbox users can view a demonstration on loading and using the Rolling Monthly GeoMAD in a demonstration notebook.