Desertification and Drought Day, observed every year on 17 June, is led by the United Nations Convention to Combat Desertification (UNCCD) to promote international efforts of combating desertification and drought. Today we join the National Bureau of Statistics (NBS) Tanzania to share how Earth observation (EO) can be used to monitor the effects of drought.
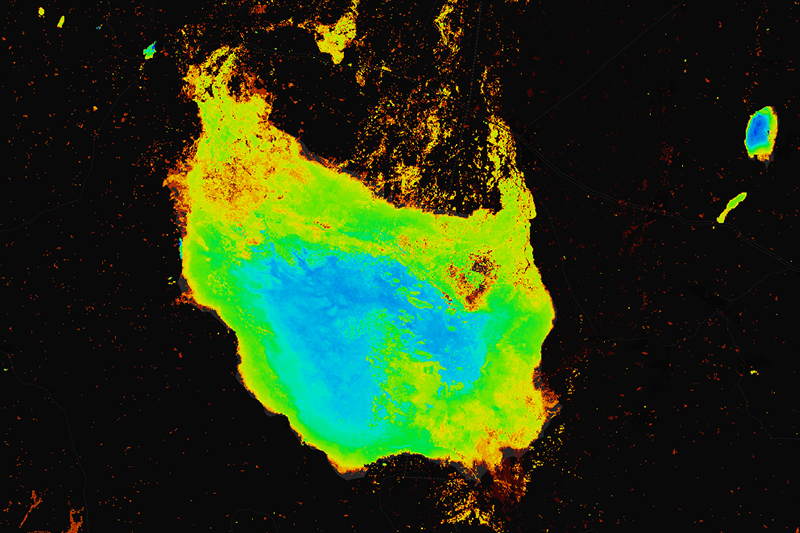
Lake Sulunga, also known as Bahi Swamp, is located in Central Tanzania and relied upon by many surrounding settlements for drinking water, fishing, agriculture, livestock farming and salt production. Situated in a semi-arid and drought prone region, climate-related natural disasters threaten the lake, and the communities who depend on it. In March 2019, NBS conducted ground validation and revealed that communities have encroached on the banks of the lakes as it shrinks.
To better understand changes to Lake Sulunga and inform better policy decisions, NBS are now using Digital Earth Africa (DE Africa) analysis-ready satellite data to conduct analysis on its water extent over time. Mr Benedict Mugambi, Head of Geographic Information System (GIS) at NBS, first integrated EO analysis to strengthen the use of environmental statistics as a participant of the Africa Regional Data Cube (ARDC), led by the Global Partnerships for Sustainable Development Data (GPSDD). They have been among the first advanced users to transition to the new DE Africa continental-wide infrastructure.
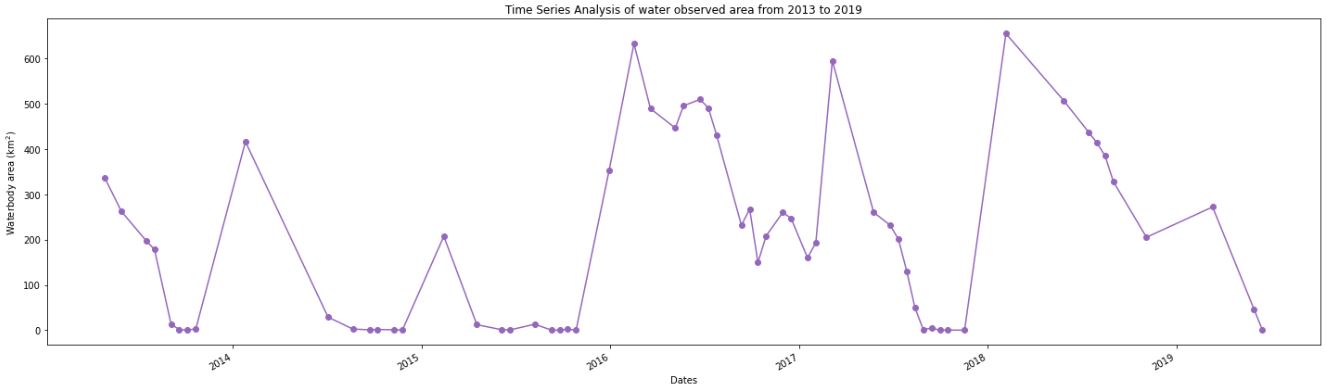
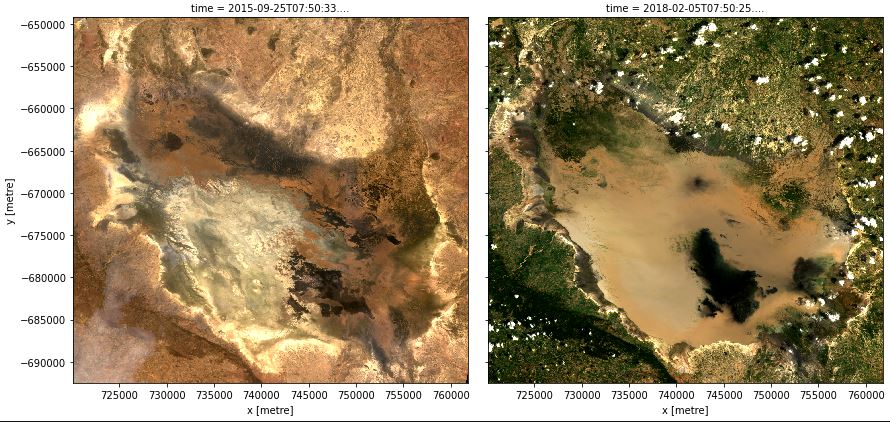
We have worked with Mr Mugambi to transition the NBS use case into the new platform and conducted further analysis of Lake Sulunga using the Water Observations from Space (WOfS) product available both in the DE Africa Map portal and DE Africa Sandbox interface for advanced analysis. This has allowed for time-series analysis over a six-year period from 2013 to 2019 in order to plot the minimum and maximum water extents. This type of analysis helps to monitor when the lake experiences variations in volume and depth to understand and plan for those times throughout the year in the future.
The use of satellite imagery for monitoring the area increases the ability to achieve UN Sustainable Development Goal 6.6.1 and monitoring the change in extent of water-related ecosystems over time. Providing this valuable information will help NBS engage with policy makers to drive better decisions on water policies in the interest of people and the environment.
Find out more about Desertification and Drought Day.